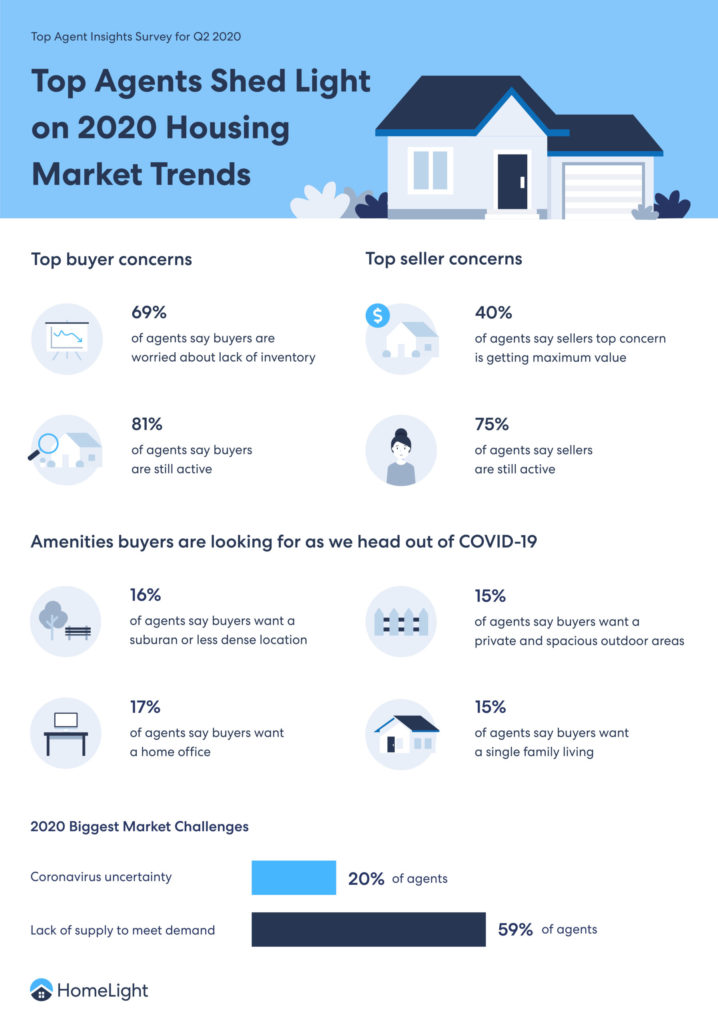
This market update comes courtesy of Homelight.
U.S. Real Estate Market Overview: National Housing Trends and Insights
Sunday afternoon open houses, a surge in buyer traffic, for-sale signs taking over front lawns — these were meant to be the hallmarks of a busy 2020 spring real estate season. Instead, the market hit a wall when the coronavirus unleashed a public health crisis of unprecedented proportions and challenged the traditional ways of buying and selling homes like never before.
While the pandemic knocked the wind out of many people’s plans to list or buy, the resume button is in reach as signs of hope and resilience emerge in the spirit of settling into a new normal. Let’s take a look at how some key market indicators offer clues into the next chapter of U.S. real estate at the national level.
Drop in new home sales reflects early buyer fears
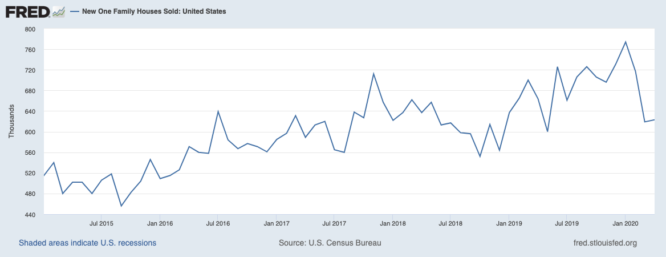
In March, sales of newly constructed single-family homes tumbled 14% month over month to an annual sales rate of 619,000 homes, according to data from the Census Bureau.
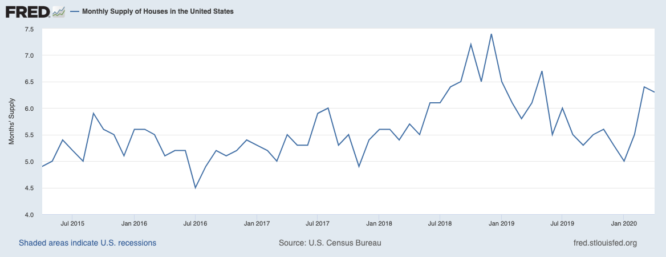
The slower pace of sales caused an uptick in the supply of new homes, from 327,000 homes in February, to 331,000 in March. This put new homes at a 6.4 months level of supply (a measurement of how long it would take to sell all of the new homes on the market, if no new homes were built) up from 5.5 months in February.
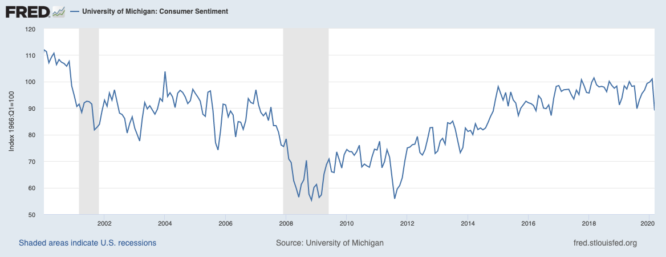
Because new home sales measure contract signings, rather than closings, this data from the Census Bureau was one of the first real-time signals of demand headwinds caused by the pandemic. During the same period, consumer sentiment dropped 11.8%, data from the University of Michigan shows — and consumer sentiment is closely tied to big purchase decisions like buying a home.
However, some positive signs of stabilization emerged just a month later: In April, new home sales essentially flattened (rising 0.6%) — which was a surprising comeback considering the previous month’s performance. As a result, new home sales supply remained fairly level, even declining slightly to 6.3 months.
Builders can’t build without definite demand
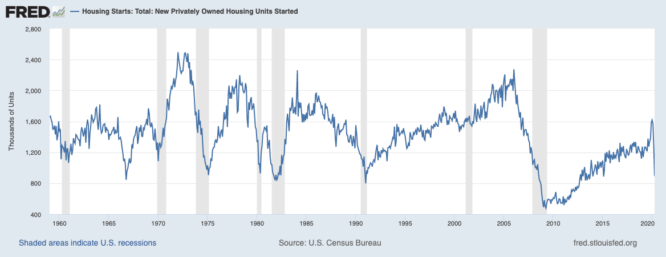
Prior to the coronavirus, many builders had started to gain momentum after struggling for years to meet insatiable buyer demand. In December 2019, housing starts jumped nearly 16% month over month and fueled hopes for robust construction moving forward.
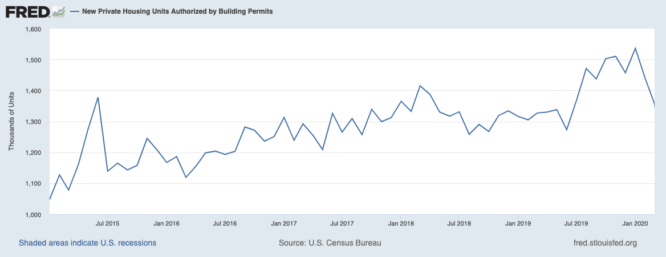
However, until builders are more confident that buyer activity will pick up, permits and starts are likely to stall. In April, authorized building permits dropped 21%, while housing starts continued their downward cascade, falling 30% from March to April.
Existing homes supply stays in ‘seller’s market’ territory
Keep in mind that new construction only accounts for about 10% of all housing market sales. Existing home sales, measured by the National Association of Realtors (NAR), are a lagging indicator as a measure of closings and account for the remaining 90%.
In April, existing home sales plunged 17.8%, no doubt a reflection of the stay-at-home or shelter-in-place directives that froze Americans in place across much of the country.